If you have ever tried to write a clean “Location” section for an IC memo, OM, or investor email, you know the drill.
You open Google Maps. You bounce between satellite, Street View, and search results. You pull demographics from a separate tool. You copy business names into a scratchpad. Then you spend another twenty minutes turning scattered notes into two or three paragraphs that actually sound like something an investment committee will read.
That 30–60 minute “location read” has been part of my own workflow for as long as I have been underwriting and packaging deals.
So, we decided to teach a CRE Agents AI coworker how to do it.
What We Built: Deep Location Analysis (with Demographics)
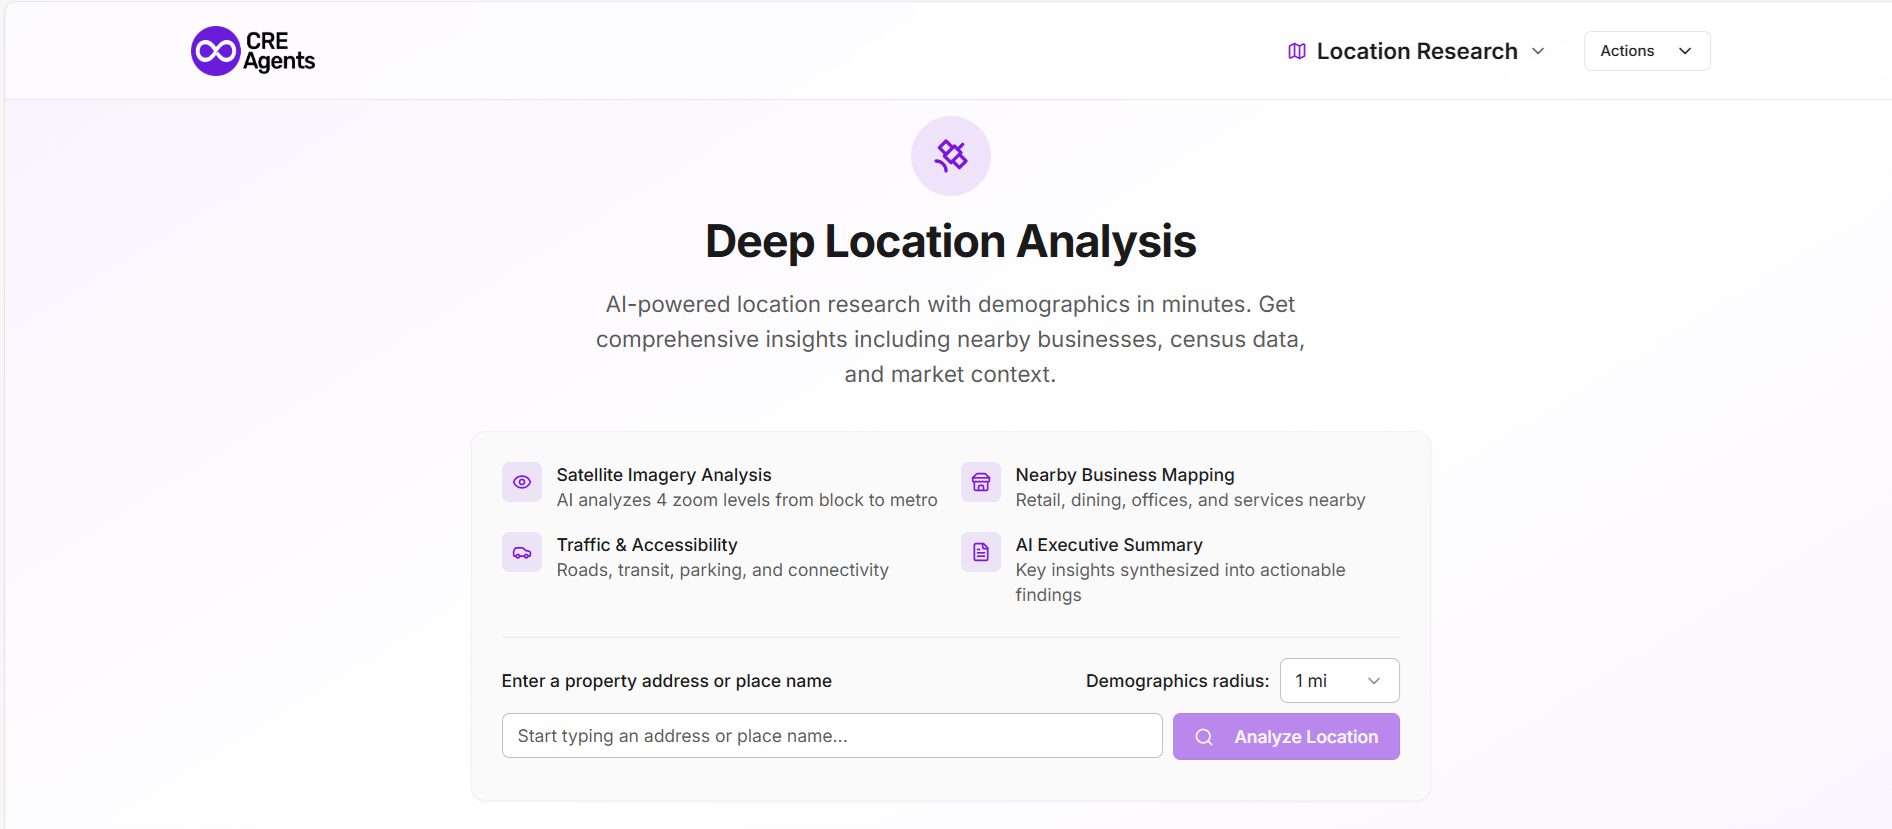
Deep Location Analysis is a CRE Agents workflow that takes a single property address and returns what most of us would call a first-draft location section.
You drop in the address. The workflow builds a location research URL, triggers an automated analysis, pulls the text and 1-mile Census demographics, and hands you back:
- A Deep Location URL you can click into and share
- A full, analyst-style location write-up
- A key facts block and 1-mile demographic table
- Simple next-step prompts (draft a narrative, list tenants, describe ingress/egress)
What used to take 30–60 minutes now takes under 5, with more consistency and far less context switching.
A Real Example: 100 North Riverside, Chicago
To make this concrete, here is an excerpt from a run we did on 100 North Riverside Plaza in Chicago.
The workflow starts with a short header: address, coordinates, the date we analyzed it, and quick actions to copy the link or export to PDF.
Then it moves into a three-paragraph Location Summary that already sounds like a human analyst:
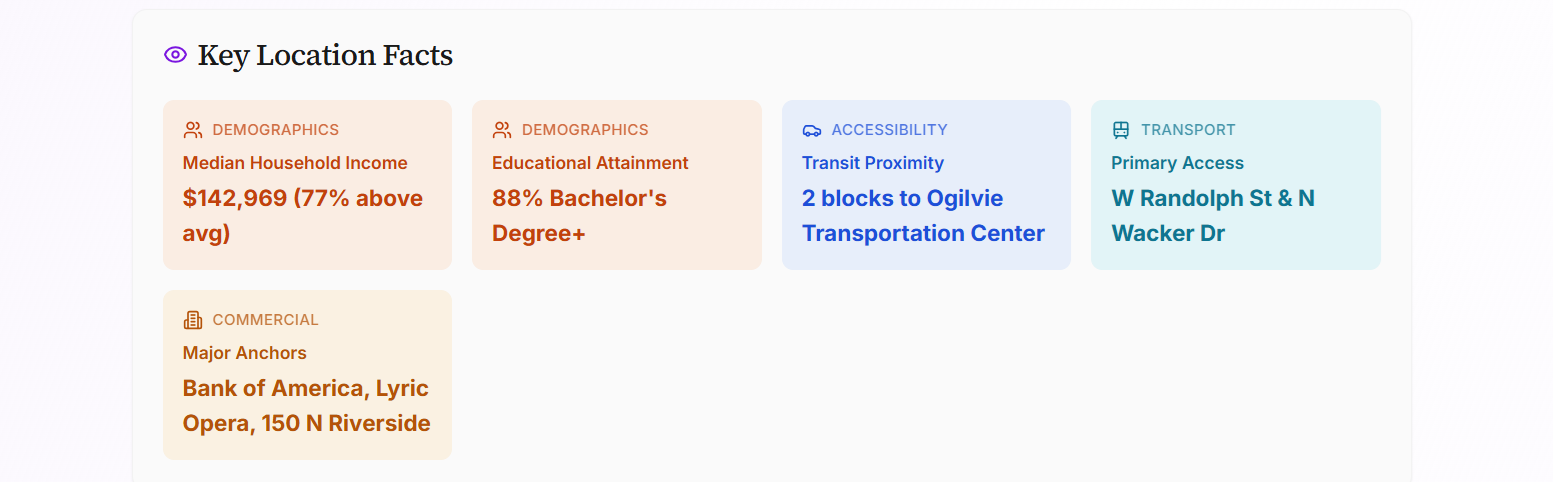
The subject property occupies a premium riverfront position at the intersection of the West Loop and the central business district, characterized by high-density office towers and luxury residential units. Within a 1-mile radius, the median household income is $142,969 (77% above national average) with a highly educated population where 88% of residents hold a bachelor’s degree or higher. The demographic profile is exceptionally young and affluent, with a median age of 32.2 and per capita income 164% above the national average.
Immediate adjacencies include the Ogilvie Transportation Center and the 150 North Riverside office tower, providing massive daily foot traffic from commuters and white-collar professionals. The site is anchored by high-end national and regional hospitality brands such as Beatrix, Small Cheval, and Bazaar Meat, alongside major corporate hubs for Bank of America and CoStar Group. Primary access is provided by the W Randolph St bridge and N Wacker Drive, with the I-90/94 expressway located less than a mile to the west.
Strengths include unparalleled transit connectivity via Metra and ‘L’ lines, coupled with a high-income daytime population that supports premium retail and dining. The riverfront location offers significant aesthetic value and pedestrian engagement via the Chicago Riverwalk. The primary limitation is the low owner-occupancy rate (32%), reflecting a transient, renter-heavy market that may be sensitive to shifts in corporate office occupancy trends.
In three paragraphs, you already have:
- Physical context: riverfront, West Loop + CBD edge
- Income, age, education, and renter profile
- Key adjacencies and anchors
- Access summary and a clear statement of strengths and limitations
If you pasted this under “Location” in a memo, most readers would assume a human analyst spent time on it.
Below that, the workflow breaks out Key Location Facts (median income, education, transit proximity, primary access, major anchors) and then a full Census Demographics section for the 1-mile radius:
- Population and density
- Median household income and per capita income vs national averages
- Median home value and rent
- Owner vs renter split
- Median age
- Unemployment rate
All of this is standardized, labeled, and ready to drop into your materials.
On the same page, you see Nearby Places within ¼ mile, broken into Retail & Shopping, Food & Dining, and Services, each with name and distance:
- Starbucks, Potbelly, Dunkin’
- Small Cheval, Bazaar Meat, Beatnik On The River
- Bank of America, CoStar, Oak Street, JLL, various professional services
You get an immediate feel for the tenant and customer ecosystem without hunting down every dot on the map.
Finally, the Location Views section calls out four zoom levels that you can click through: Block, Neighborhood, City Context, and Metro Region. It is the same way most of us think about trade areas in our heads, but now it lives in a reusable workflow.
What’s Under the Hood
This is not a single monolithic agent trying to do everything at once. Under the hood, Deep Location Analysis is a two-agent workflow:
Create and Visit URL
- Takes the address you provide
- Builds the CRE Agents Location Research URL for that property
- Visits it once to trigger the analysis and records status flags (url_confirmed, browse_status)
Retrieve Location Analysis
- Waits for the analysis to be available
- Pulls the full location analysis text, including demographics
- If the text is not available on the standard route, rewrites the URL to a server-side rendered path and uses a code interpreter to pull and parse the content reliably
- Returns the Deep Location URL, analysis text, and user instructions, plus a short two-paragraph summary
The tools are simple but powerful:
- A web browser to hit the right URL and confirm the analysis is ready
- A code interpreter to cleanly extract the text from the rendered page, including the demographics table, and to handle the fallback path when needed
You only see a single “run,” but behind that run two agents are doing the dull, brittle work a human would normally do across several tabs.
What Data It Pulls Together For You
In terms of content, each run of the workflow gives you four main layers.
Satellite imagery across four zoom levels
- Block: immediate surroundings, adjacencies, curb cuts, parking fields
- Neighborhood: district context, key intersections, street grid
- City context: relationship to downtown, major arterials, highway access
- Metro region: positioning within the larger metro and interstate network
Nearby businesses within roughly a quarter mile
- Retail and shopping
- Food and dining
- Services and office users
For each, you get name and distance (feet or tenths of a mile), which makes it easy to build a tenant list, call out co-tenants, or validate the character of the trade area.
Census demographics within a 1-mile radius
- ACS 5-year estimates
- Values and comparison against national averages
That last part is important. You are not just told “median income is $142,969.” You are told it is 77 percent above the national average, which is how most people actually think about relative affluence.
A synthesized report plus key facts block
- A narrative summary at the top
- A handful of key stats pulled out into a labeled facts section
This is the difference between “data exhaust” and something you can paste directly into a deck, memo, or email.
Where This Fits In Your Process
There are a few obvious places where Deep Location Analysis earns its keep.
Early screening and sourcing
Run it on inbound deals so you can quickly see whether the location quality matches your box before you sink time into full underwriting.
Underwriting memos and OMs
Use the narrative and key facts as the starting point for your Location and Market sections. Edit where needed, layer in your own view on risk, and you are done.
Tenant and site selection pitches
If you are doing work for tenants or users, run prospective sites through the workflow so you can show, side-by-side, how each location stacks up in terms of demographics, access, and nearby uses.
Anywhere you currently burn half an hour clicking around Google Maps and demographic tools is a candidate.
How To Start Using It
Deep Location Analysis sits inside the CRE Agents platform as a workflow called Deep Location Analysis (with Demographics).
You need exactly one input:
- Property Address (in a standard Google Maps format)
You get back:
- A Deep Location URL you can open and share
- A complete location write-up with 1-mile demographics and nearby places
- Status indicators so you know the run completed successfully
- A short summary and suggested follow-up tasks that you can hand off to your CRE Agents AI coworker (draft a more polished narrative, list nearby tenants, describe ingress/egress)
From there, you can:
- Copy-paste text into your IC memo or OM
- Export to PDF and drop it into your deal folder
- Send the link to a teammate and ask them to react
Where I’d Like Your Feedback
My goal with this workflow was simple: take a task that every CRE professional knows is important but tedious and compress it into something you can run on every live deal without thinking about it.
If you try Deep Location Analysis on a property you are working on today, I would love to hear:
- What parts of the output you actually used
- What felt missing for your investment committee or your client
- What other “30–60 minute” research tasks you want your CRE Agents AI coworker to take on next
Looking forward to hearing how this works for your deals.