
If you are still tabbing between Census websites, CoStar, and ESRI to cobble together 1, 3, and 5 mile demographic snapshots, you are doing work an AI coworker can take off your plate.
Over the past few months, we’ve been working on a radius-based demographics engine that turns publicly available Census data into institution-ready demographic rings. I wrote about the technical methodology of that project at A.CRE. Now I want to show you what happens when that same engine is wired directly into an AI coworker inside the CRE Agents platform.
Short version: the analyst who used to burn an hour pulling data and drafting a location narrative can now hand that entire job to an AI coworker and move on to higher value work.
The Old Way: Hunting Down Demographics and Writing Narratives
If you sit in an analyst or associate seat, the pattern probably feels familiar:
- A broker sends over a deal.
- Someone says, “Can you add a quick 1, 3, 5 mile demographic snapshot and a location blurb to the investment memo?”
- You start opening tabs.
Maybe you:
- Pull population and income from a third-party tool.
- Cross-check against Census to make sure you are in the right ballpark.
- Export a PDF or CSV, clean the tables, and paste them into your memo template.
- Then stare at a blinking cursor while you try to turn those numbers into a coherent story.
On a good day, that is 30 to 45 minutes of work for a single address. If you are looking at a batch of deals, it can consume your whole afternoon.
The work is necessary. Tenants care about who lives and works around a site. Investment committees expect a point of view on trade area quality. Lenders want to see that you did your homework.
But you do not get promoted for reformatting Census tables.
The Engine Under The Hood
Before we gave this capability to AI coworkers, we needed to make sure the math was solid.
The problem: the U.S. Census publishes data by block group and tract, not by custom radii. Real estate people, on the other hand, think in rings.
1 mile.
3 miles.
5 miles.
Sometimes 10.
You cannot just grab a few nearby tracts and average them. You also cannot treat a block group as either fully inside or fully outside your circle.
So, we built a method that:
- Uses only publicly available, authoritative Census data.
- Works at the block group level, not just at the tract level.
- Computes the true geometric intersection between your radius and each block group.
- Weights values based on land area inside the circle, excluding water.
- Aggregates up to a consistent radius-level profile.
The result is a set of demographics that are:
- Auditable (you can follow the math).
- Explainable (you can describe the assumptions to a client or IC).
- Institutionally defensible (you can stand behind it in a credit memo).
That engine is now connected to the Demographics (Radius from Address) workflow inside CRE Agents.
You get the same rigor as manually doing it, but your AI coworker uses it for you.
What Your AI Coworker Actually Does
On the CRE Agents platform, your AI coworker can call a workflow called Demographics (Radius from Address).
Here is what that looks like in practice.
You give your coworker a simple request:
“For 123 Main St, Dallas TX, pull 3-mile radius demographics and draft a two paragraph narrative for an IC memo.”
Behind the scenes, the coworker:
- Takes the address and radius settings. You can specify any radius between 0.5 and 10 miles. One ring or several rings..
- Runs the Demographics (Radius from Address) workflow. The workflow converts the address to coordinates, finds the relevant block groups, computes the intersections, and pulls Census data. Same methodology as outlined in the A.CRE article.
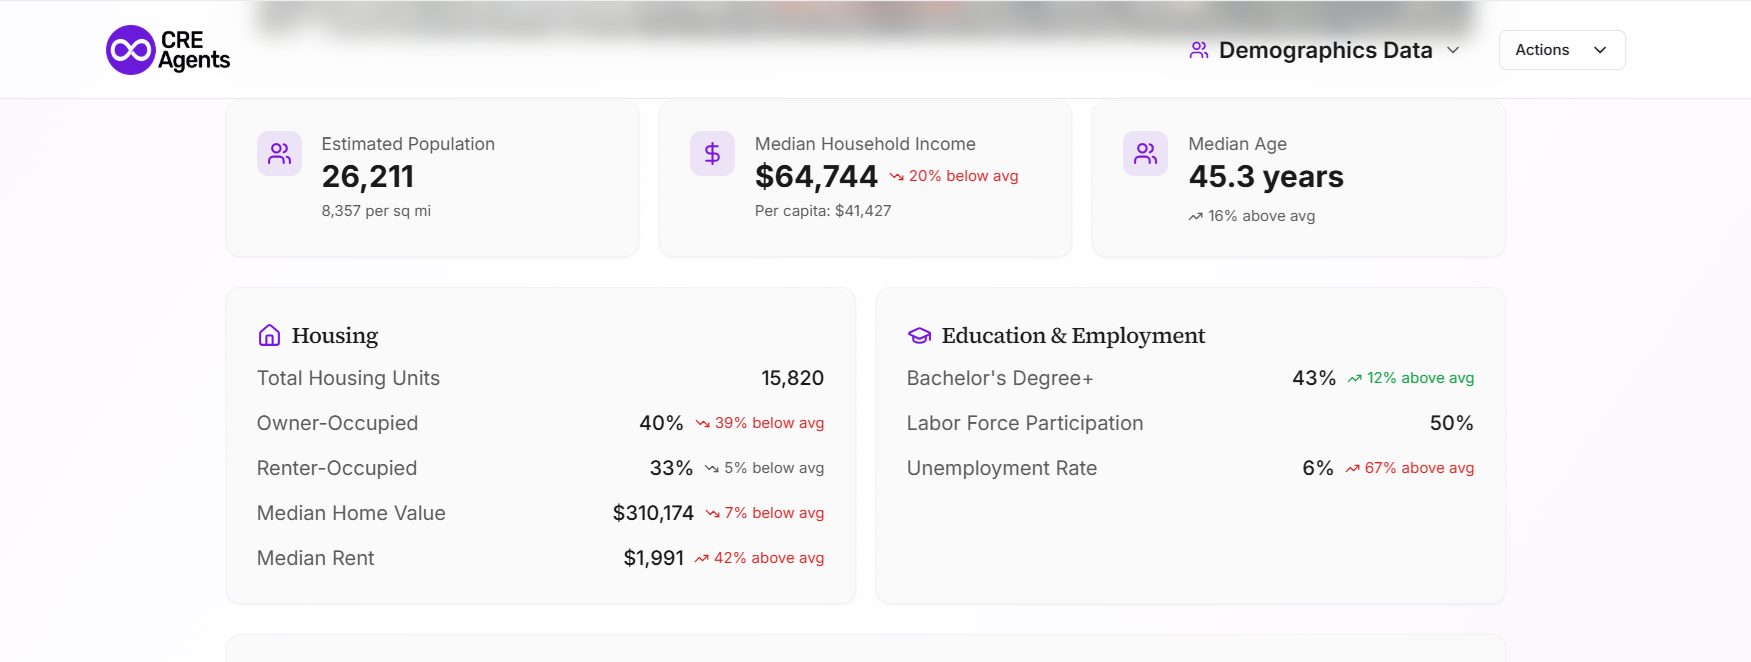
- Returns a stylized demographics page. You get a clean, shareable page for that address and radius, with typical stats like:
- Total population
- Household counts and growth
- Income metrics
- Age distribution
- Basic race and ethnicity breakdown
- Housing occupancy metrics
You can keep the page as-is, export it, or link it directly in your materials. Click here to view an example of a demographics page.
- Drafts the location narrative for you. Because the coworker can read that stylized page, it can summarize the key points in natural language tailored to your use case:
- IC memo, with concise, fact-focused language.
- Broker opinion of value, with more positioning.
- Lender package, with an emphasis on stability and depth of demand.
- Adapts and iterates on request. You can ask:
- “Tighten this to 4 sentences.”
- “Make it more accessible for a non-real-estate audience.”
- “Highlight the income growth story more than the population level.”
You still control the judgment. You read what it wrote, tweak a sentence or two, and move on.
The hours you used to spend assembling tables and writing first drafts are now a few minutes of review.
Day In the Life with an AI Coworker
Picture a Tuesday morning.
You open your inbox to:
- Three new off-market retail deals from one broker.
- Plus two industrial assets a colleague wants you to “take a quick look at.”
In the old world, that probably meant:
- Five separate runs through your demographic tool of choice.
- Copy-paste clean-up in PowerPoint or Word.
- A mix of one-off narratives, each written from scratch.
With an AI coworker on CRE Agents:
- You drop the five addresses into a single message.
- You specify the radii you care about and the output format.
- Fifteen or twenty minutes later (while you work on other things!), you have:
- Five stylized demographic pages, one per address.
- Draft narratives for each, already framed for your IC template.
- A short comparison note that calls out which sites look strongest on population, income, and growth.
Your time went into deciding what to do with those insights, not producing them!
How To Try This on The CRE Agents Platform
If you want an AI coworker that can do this kind of work for you, the path is straightforward:
- Select an AI coworker with this workflow enabled. For acquisitions or underwriting, this is often an “Acquisitions Analyst” style coworker.
- Give it a real task from your pipeline, for example:
“For 456 Elm St, Phoenix AZ, pull 1 and 3 mile demographics and draft a short location section suitable for a lender memo. Then give me one paragraph comparing those rings to metro averages based on Census data.”
- Review, adjust, and reuse the pattern. Save the task instructions that work well for your firm so the coworker can repeat them across deals.
The learning curve is low. You already know what “good” looks like for a demographic section. The coworker simply takes the first 80 to 90 percent of the work off your desk.
Where This Is Going
Radius demographics is just one example of the kind of work AI coworkers should handle for you.
If you are an analyst or associate who has been doing this by hand for years, the shift is simple: move from being the person who pulls the data and writes from scratch to the person who sets the standard and checks the output.
If you want an AI coworker that can run that process for any address you care about, consider joining CRE Agents.
Frequently Asked Questions About AI-Powered Radius Demographics For CRE
The engine uses the same underlying source, publicly available U.S. Census data at the block group level, that most paid platforms rely on. The difference is in the weighting method. Rather than treating block groups as fully inside or outside your radius, it computes the true geometric intersection and weights values by land area excluding water. The result is auditable and institutionally defensible. Paid tools may layer on proprietary projections or consumer spending data that this engine does not include, so firms that need forward-looking demographic forecasts may still use both sources together.
The engine pulls from the most recent American Community Survey release, which the Census Bureau updates annually with rolling five-year estimates. This means the data reflects conditions from roughly one to two years prior, which is consistent with what lenders and investment committees expect in demographic sections. For fast-moving markets where you need more current population or income estimates, you can supplement with local economic development data or third-party projections and note the source in your memo.
The radius demographics engine currently uses U.S. Census data only, so it is limited to domestic properties. For international assets, your AI coworker can still draft location narratives if you provide the demographic data manually or from a local source. The workflow structure is the same. You would just supply the inputs rather than having the engine pull them automatically.